For the past twelve years, Google Trends — those delightfully geeky, data-oriented folks at Google who creepily keep track of what the world is searching for (online, at least) — has been keeping track of weekly search data for hundreds of dishes and ingredients. As you might expect, it's pretty interesting. It might not be surprising that certain foods have "seasons" (e.g. ham searches spike around Easter time and chili is a more popular search in cold months than in warm ones), but some of what they've found is downright amusing and amazing. For instance, if you thought that pumpkin spice lattes have been becoming more popular, you'd be right, but it's also one of those seasonal items that has had an ever-growing season since 2011. If you're a fan of the creamy beverage, that's good news since you can enjoy it earlier and later each year. If you're not a fan, it gives you one more reason to hate it.

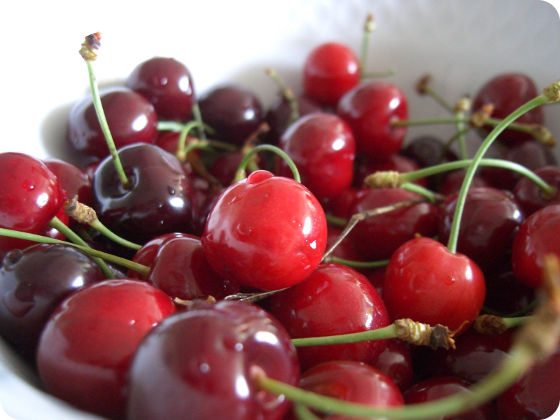
Then there are the downright hilarious spikes in search data that really have nothing to do with the food item in question at all. You could call it a case of mistaken identity. For instance, in early February 2011, a band called "The Kills" threw off the results for sour cherries when their hit song "Sour Cherry" topped charts. The folks at Google Trends failed to mention if the global sour cherry market saw any corresponding benefit, but I'd like to believe the fruit got at least a little boost from the association!

If you're interested in finding our more about The Rhythm of Food project, visit their site and poke around. The graphics are fun to explore and really quite beautiful. One item I found particularly insightful was the different kinds of year clock graphics that can be plotted depending on geographical location. For instance, kale has one year clock for searches across the globe and quite different ones if you focus in on places like Germany or Japan, which both enjoy kale quite a bit in their cuisine but have varieties that have vastly different growing seasons and uses within their cooking traditions. So explore a bit and enjoy the cross section of culinary curiosity and data-driven interactive plots. Hooray for learning more about our world!
